You can find the project Here. The API Docs for the DS app can be found Here
High level overview presentation Here.
Deep dive into cleaning the data Here.
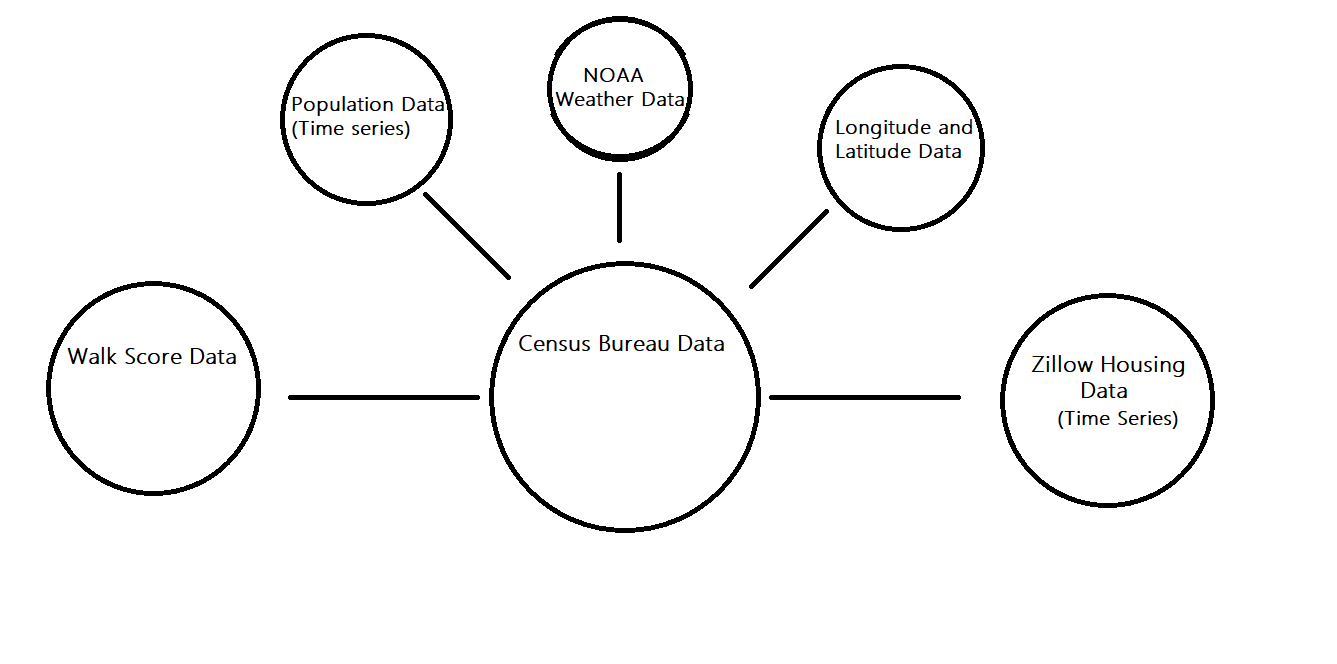
Datasets used Here
| Scott Maxwell | Matthew Sessions | Luke Townsend |
|---|---|---|
 |
 |
 |
| |
|
|
Citrics provides statistics on 28,924 different locations in the United States that are available for viewing. This was created with a team of web developers and data engineers. These statistics include information about housing prices, employment, lifestyle and much more.
- Python
- Flask
- Docker
- Jupyter Notebooks
- Mongo DB
- AWS Elastic Beanstalk
- AWS PostgreSQL
The following models are using a K-Nearest Neighbors KD-Tree algorithm from the Scikit-Learn Python Library
Features & Metrics Used:
- Median Rent
- Occupants per room
- Housing by bedrooms
- Vacancy Rate
- Rent Pricing
- Historical Property Value
- Historical Property Value Growth by %
Features & Metrics Used:
- Industry Types
- Health insurance
- Salary
- Commute & travel time
- Retirement
- Unemployment
Features & Metrics used:
- Education
- Language
- Ethnicity
- Birth Rate
- Population
Note: AWS EB has a hard time runing Numpy and Scipy. These libraries power Sklearn. Also, the joblib library had a hard time running models that were trained on different operating systems. Once we found models that worked, we exported the code to a python script and ran it on a Linux based machines runing python 3.6. We then used Docker to contain and ship our flask app. These steps allowed us to seamlessly deploy predictive models.
How we pushed our data to MongoDB
You can find documentation for the API here