Debug code with Visual Studio Code
Use the debugger in Visual Studio Code to pause your application, inspect its state, and step through code to find the cause of a problem. This article guides you through your first debugging session and introduces the tools you use to investigate issues.
VS Code includes a debugger for JavaScript, TypeScript, and Node.js. For other languages and runtimes, install a debugger extension.
Start a debugging session
To run your code until it reaches a breakpoint:
-
Open the source file that you want to debug.
-
Set a breakpoint by selecting the editor margin next to a line of executable code or by pressing F9.
A red circle indicates a breakpoint.
-
Start debugging with F5, or open the Run and Debug view (⇧⌘D (Windows, Linux Ctrl+Shift+D)) and select Run and Debug.
-
If prompted, select the debugger for your language or runtime.
For a simple application, VS Code tries to run the active file. If your application requires a specific entry point, command-line arguments, environment variables, or another custom setup, create a
launch.jsonconfiguration. -
When execution pauses at the breakpoint, inspect values in the VARIABLES section and review the function calls in the CALL STACK section.
-
Use the Debug toolbar to continue execution, step through code, restart the application, or stop debugging.
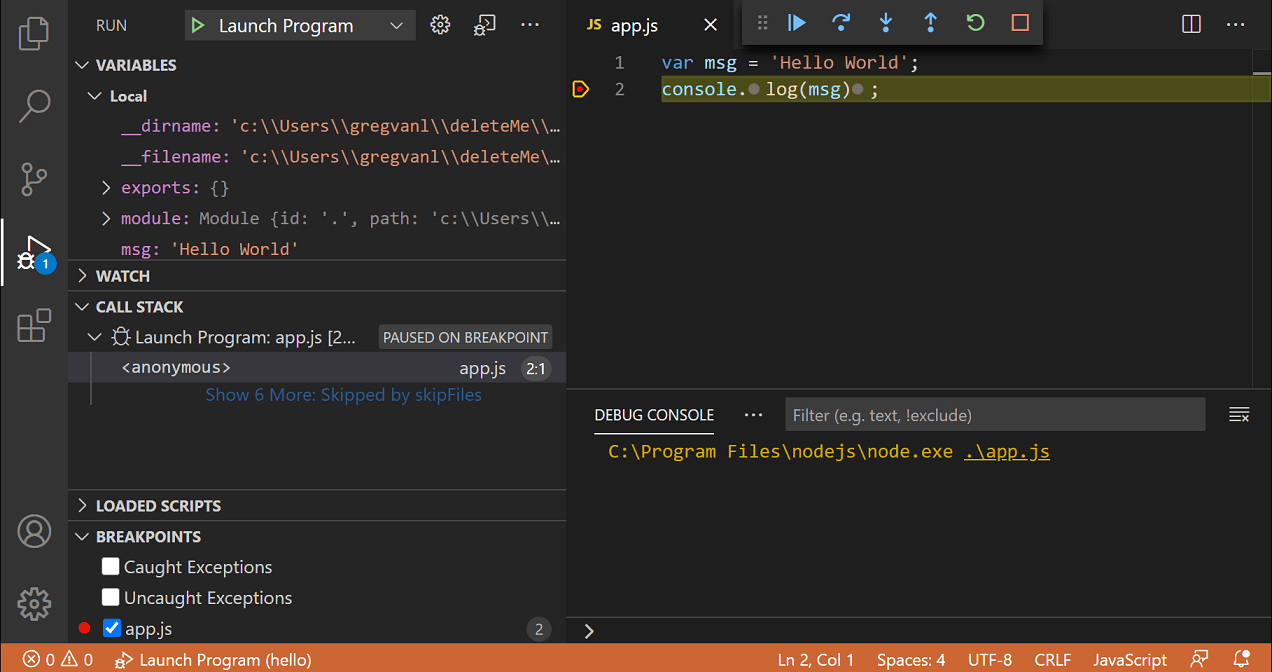
Debugger user interface
During a debugging session, use these areas of the interface:
- Run and Debug view: inspect variables and expressions, manage breakpoints, and navigate the call stack.
- Editor: see the current execution line, set breakpoints, and inspect values inline or by hovering over code.
- Debug toolbar: control the flow of the application.
- Debug Console: view debugger output and evaluate expressions.
- Debug status: select the active debug configuration from the Status Bar.
Debug actions
The Debug toolbar appears when a debugging session starts. The available actions can vary by debugger.
| Action | Description |
|---|---|
| Continue or Pause F5 |
Resume execution until the next breakpoint, or pause a running program. |
| Step Over F10 |
Run the current line without stepping into function calls on that line. |
| Step Into F11 |
Step into the function called on the current line. |
| Step Out ⇧F11 (Windows, Linux Shift+F11) |
Finish the current function and pause in the calling function. |
| Restart ⇧⌘F5 (Windows, Linux Ctrl+Shift+F5) |
Stop and start the application again with the current debug configuration. |
| Stop ⇧F5 (Windows, Linux Shift+F5) |
End the current debugging session. |
If you debug multiple targets, the toolbar also lets you select the active session.
Use the
debug.toolBarLocation
setting to show the Debug toolbar as floating, docked in the Run and Debug view, or hidden.
Breakpoints
A breakpoint pauses your application at a specific point so that you can inspect its state. Breakpoint behavior can vary by debugger and programming language.
Setting breakpoints
To set or remove a breakpoint on the current line, select the editor margin or use F9.
The breakpoint icon indicates its state:
- A filled red circle indicates an enabled breakpoint.
- A filled gray circle indicates a disabled breakpoint.
- A hollow gray circle indicates that the debugger could not register the breakpoint. This might happen when the line has no executable code or the debugger does not support the source file.
Use the BREAKPOINTS section in the Run and Debug view to enable, disable, edit, or remove breakpoints. To group breakpoints by file in a tree, set
debug.breakpointsView.presentation
to tree.
To also show breakpoints in the editor overview ruler, turn on the debug.showBreakpointsInOverviewRuler setting.
Breakpoint types
Debugger extensions determine which breakpoint types and conditions they support.
Conditional breakpoints
A conditional breakpoint pauses execution only when a specified condition is met. You can use:
- Expression condition: pause when an expression evaluates to
true. - Hit count: pause after the breakpoint is reached a specified number of times. Supported syntax varies by debugger.
- Wait for breakpoint: activate the breakpoint after another breakpoint is hit. This creates a triggered breakpoint.
To add a conditional breakpoint:
-
Open the editor margin context menu and select Add Conditional Breakpoint, or run Debug: Add Conditional Breakpoint... from the Command Palette (⇧⌘P (Windows, Linux Ctrl+Shift+P)).
-
Select the condition type.
-
Enter the expression, hit count, or breakpoint that activates it, and then press Enter.
To add or change a condition on an existing breakpoint, open the breakpoint context menu and select Edit Breakpoint. You can also select the pencil icon for the breakpoint in the BREAKPOINTS section.
Triggered breakpoints
A triggered breakpoint is enabled after another breakpoint is hit. Use one when a failure occurs only after a specific code path or application state.
To create one, open the editor margin context menu, select Add Triggered Breakpoint, and then select the breakpoint that activates it.
Inline breakpoints
An inline breakpoint pauses at a specific column. This is useful for a line that contains multiple statements, such as minified code.
To set an inline breakpoint, use ⇧F9 (Windows, Linux Shift+F9) or the editor context menu during a debugging session. Inline breakpoints can also have conditions.
Function breakpoints
A function breakpoint pauses when execution enters a function. This is useful when you know the function name but do not have its source code open.
To create one, select the + button in the BREAKPOINTS section and enter the function name. Function breakpoints appear as red triangles.
Data breakpoints
A data breakpoint pauses when the value of a variable changes, is read, or is accessed. The available options depend on the debugger.
To create one, open the context menu for a variable in the VARIABLES section and select an available Break on action. Data breakpoints appear as red hexagons.
Logpoints
A logpoint writes a message to the Debug Console without pausing execution. Use logpoints to inspect values without adding logging statements to your source code.
To add a logpoint, open the editor margin context menu and select Add Logpoint, or run Debug: Add Logpoint... from the Command Palette (⇧⌘P (Windows, Linux Ctrl+Shift+P)). Enter plain text and include expressions in curly braces, such as User ID: {user.id}.
Logpoints appear as diamond-shaped icons. You can add conditions and hit counts to them. To toggle logpoints with the middle mouse button in the editor margin, configure the debug.gutterMiddleClickAction setting.
Logpoints are available only when the debugger extension implements them.
Data inspection
When execution pauses, inspect the current application state in the Run and Debug view or evaluate expressions in the Debug Console.
Run and Debug view
The selected stack frame determines which variables and expressions are available:
- VARIABLES shows local and global variables for the selected stack frame. To modify a value during the session, open the variable context menu and select Set Value (Enter (Windows, Linux F2)).
- WATCH evaluates expressions whenever the debugger pauses. Use Copy as Expression on a variable to add an expression that accesses it.
- CALL STACK shows the active function calls. Select a stack frame to inspect its source location and variables.
To filter variables by name or value, focus the VARIABLES section, use ⌥⌘F (Windows, Linux Ctrl+Alt+F), and enter a search term.
You can also hover over an expression in the editor to inspect its current value.
Debug console REPL
The Debug Console is a REPL (Read-Eval-Print Loop) for the active debugging session. It shows debugger output and lets you evaluate expressions in the context of the selected stack frame.
Open it with View: Debug Console (⇧⌘Y (Windows, Linux Ctrl+Shift+Y)). Enter an expression and press Enter. For multiline input, use Shift+Enter between lines, and then press Enter to evaluate the complete expression.
Expression syntax and evaluation support depend on the debugger. An active debugging session is required.
Multi-target debugging
For applications with multiple processes, such as a client and a server, start one debug session and then start another. When more than one session is active:
- Each session appears as a top-level item in the CALL STACK section.
- The Debug toolbar shows the active session and provides a dropdown for switching sessions.
- Debug actions apply to the active session.
For a repeatable setup that starts multiple debug configurations together, create a compound launch configuration.
Remote debugging
Remote debugging support depends on the debugger extension. Review the extension's documentation for connection requirements and supported environments.
The built-in Node.js debugger supports remote debugging. For setup details, see Remote debugging with Node.js.
Debugger extensions
VS Code includes debugging support for Node.js and for JavaScript, TypeScript, and languages that compile to JavaScript.
For other languages and runtimes, install an extension from the Visual Studio Marketplace. You can also select Install Additional Debuggers from the Run menu.
Debugger extensions define their supported launch configurations, breakpoint types, expression syntax, and remote debugging capabilities. Consult the extension documentation when an option described in this article is unavailable.
Next steps
- Configure debugging - Create and customize reusable
launch.jsonconfigurations. - Debug Node.js applications - Learn about the built-in JavaScript and Node.js debugger.
- Debug and fix issues with Copilot - Use AI-assisted tools to investigate and fix problems.